The Rules of Engagement
Paresh Kharya, Adobe Systems
Expertise Level: Intermediate
Online meetings and webinars can be as effective as physical meetings at holding audience attention and communicating a message effectively. Adobe Connect provides a wealth of features that presenters can use to encourage audiences to participate , keeping the discussions lively. However, physical meetings have one significant advantage?a view of the audience. It is easier for presenters to monitor audience attentiveness by observing their reactions and expressions. Knowing your audience?s attentiveness is important in adjusting the pace of the session, ensuring proper delivery of your message. So with Adobe Connect 9 we introduced a new metric to measure audience engagement and attentiveness, the engagement index.
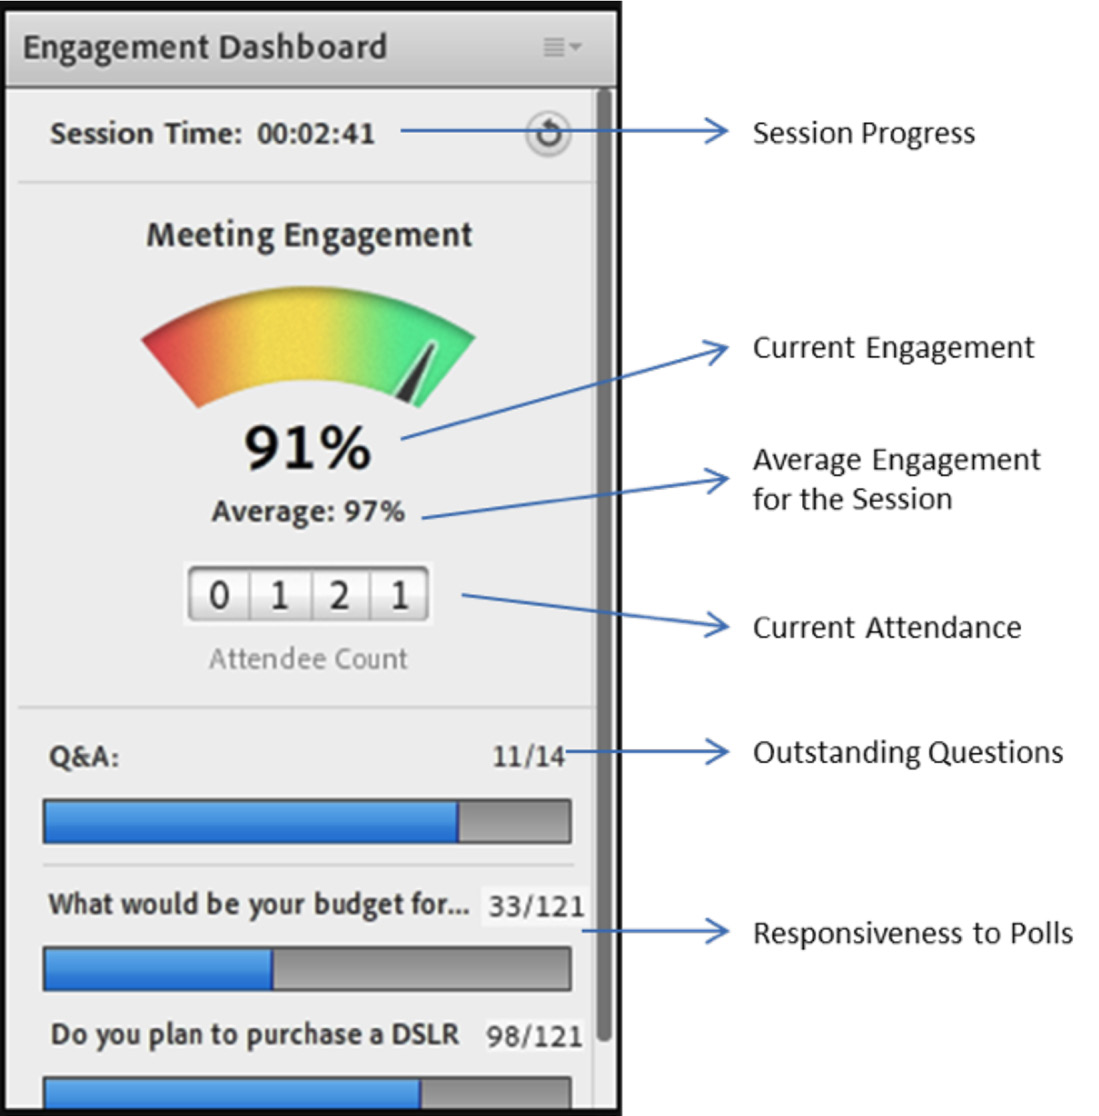
The engagement index can now be visible to presenters during seminars, events, and virtual classrooms in the new Engagement Dashboard pod.
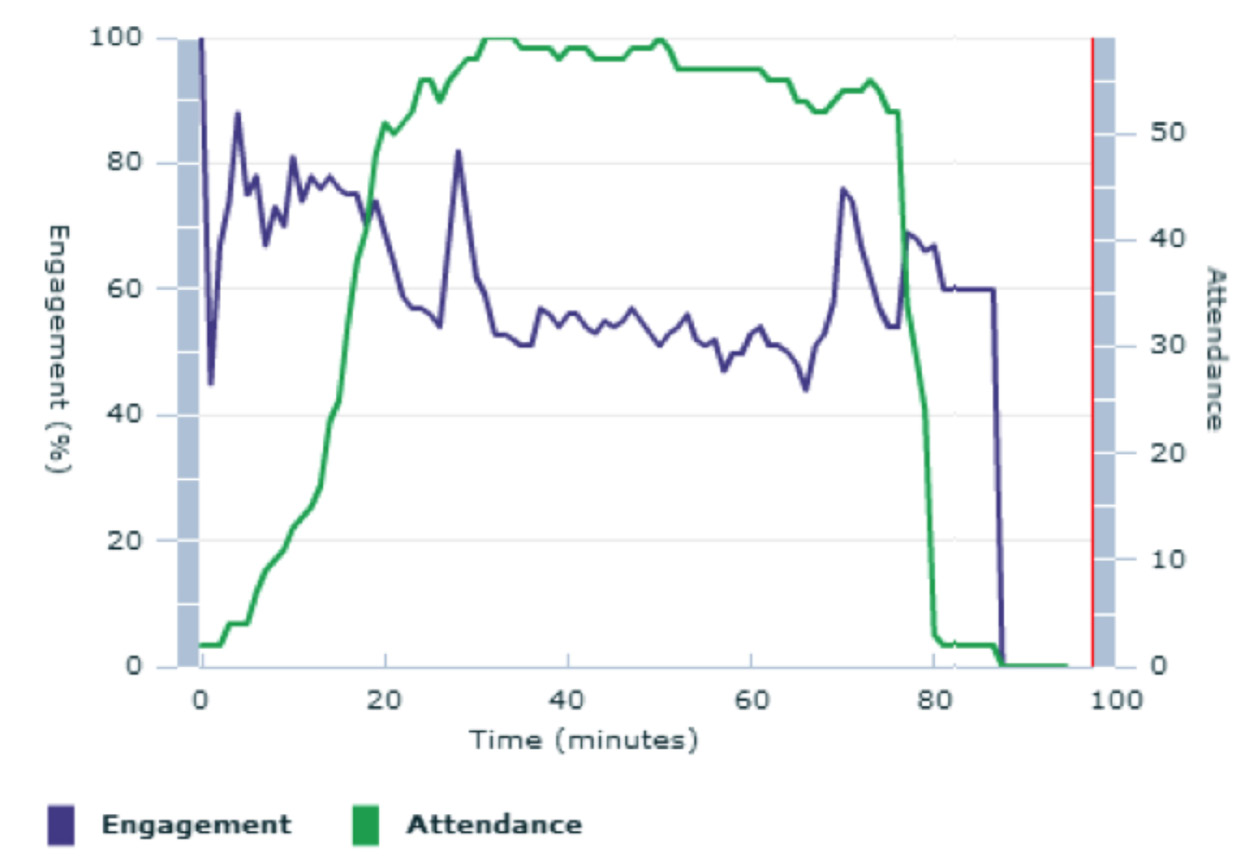
Also, when using the Adobe Connect Events module, a chart showing minute-by-minute engagement scores is available after the meeting. Presenters can go back and look at the sections of the meeting that were more or less engaging than others to improve their future presentations.
For privacy, Adobe Connect provides options for hosts to allow meeting participants to opt-out of being tracked for engagement.
This tutorial describes in detail how the engagement index is calculated in Adobe Connect and offers ideas on how to keep participants engaged.
Engagement Dashboard
|
Presenting to a large group of people is challenging even in an online environment. Presenters want to be focused on their content and not distracted while they are presenting. At the same time, they?d like to keep track of audience engagement. Adobe Connect simplifies the visualization of engagement with a graphical index, or meter, that presenters can glance at to stay abreast of participant engagement. In addition to engagement, the dashboard shows several key indicators of interaction. If the Q&A pod is being used, it shows how many questions have been asked, and how many. If polls are used, it shows how many users have taken the poll. It also shows attendance and time of the session. Presenters know, at a glance, the status of their meetings. |
 |
Engagement Index Calculation
The overall engagement index for the meeting is measured between 0 and 100 percent. It is the average of the engagement of all individuals in the meeting including the host, presenter, and participant roles. Individual engagement is measured over a period of 1 minute. The actual score depends on user activity during the Adobe Connect meeting and the duration of that activity.
Different activities have different engagement point values. The following are events and actions that provide engagement points to an individual:
- Explicit activities give 100 points to an individual including:
- Chat activity?Chatting privately and publicly
- Q&A activity?Asking questions, adding, assigning, and deleting
- Poll activity?Responding to a poll
- File download?Downloading a file
- Notes pod activity?Typing
- Status updates
- 10 points if status is stepped away
- 100 points for all other status updates
- Mouse activities?80 points for activities like clicking to start a webcam, scrolling a notes pod, and so on
- Meeting window focus
- 70 points if meeting browser tab/add-in has focus
- Otherwise, 20 points
- 10 points if meeting add-in is minimized
- 70 points if meeting browser tab/add-in has focus
If a user performs more than one activity that affects engagement in the one-minute slot, the highest point for any activity (to a maximum of 100) in that period is taken. Since different participants can have a different one-minute time slots based on their joining time, it might take anywhere from 1 to 2 minutes for the meeting?s overall engagement index to change.
Decay Factor
Based on our analysis, highly engaging meetings have users interacting every 3 to 5 minutes. To give users credit beyond their minute of activity, the engagement scores due to explicit activity decline gradually over a period of 5 minutes. The decay rate is specified as [100%, 80%, 60%, 40%, 20%] over a period of 5 minutes for any activity. For example, an activity of 80 will decay over a period of 5 minutes as 80,64,48,32,16.
Using the engagement index
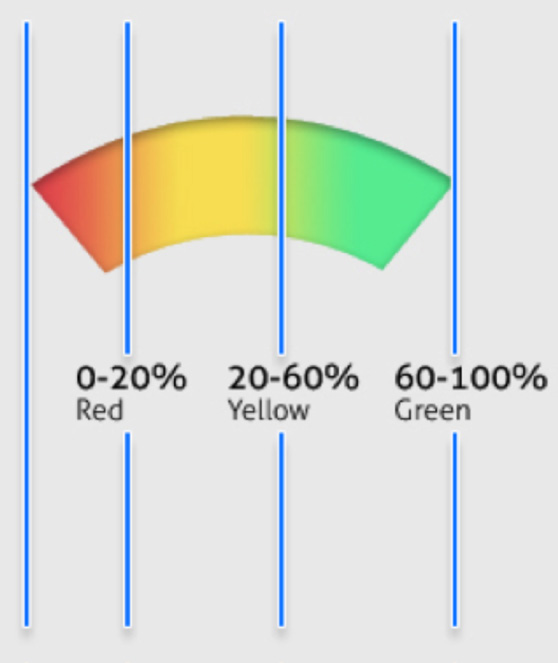
Engagement scores are very effective in determining user engagement, especially for large meetings (more than 25 participants). The Engagement Dashboard can be enabled from the Pods menu and will appear in the meeting?s Presenter Only Area for seminars, virtual classrooms, or live events. Thanks to the flexible layout, presenters can position the Engagement Dashboard where it is convenient for them to glance at once in a while. High, medium, and low engagement is depicted by color. Our analysis shows that meetings with an engagement score of 60 or higher have highly engaged participants, and such meetings are usually effective in delivering the message. Meetings with an engagement score of less than 20 have most participants disengaged. A minute-by-minute engagement report is also available as a part of the event reports for post-meeting analysis. The detailed engagement report can help in identifying sections of the meeting where engagement is low or high. Presenters can then analyze the content and the presentation to improve sections where the engagement score is low. |
|
 |
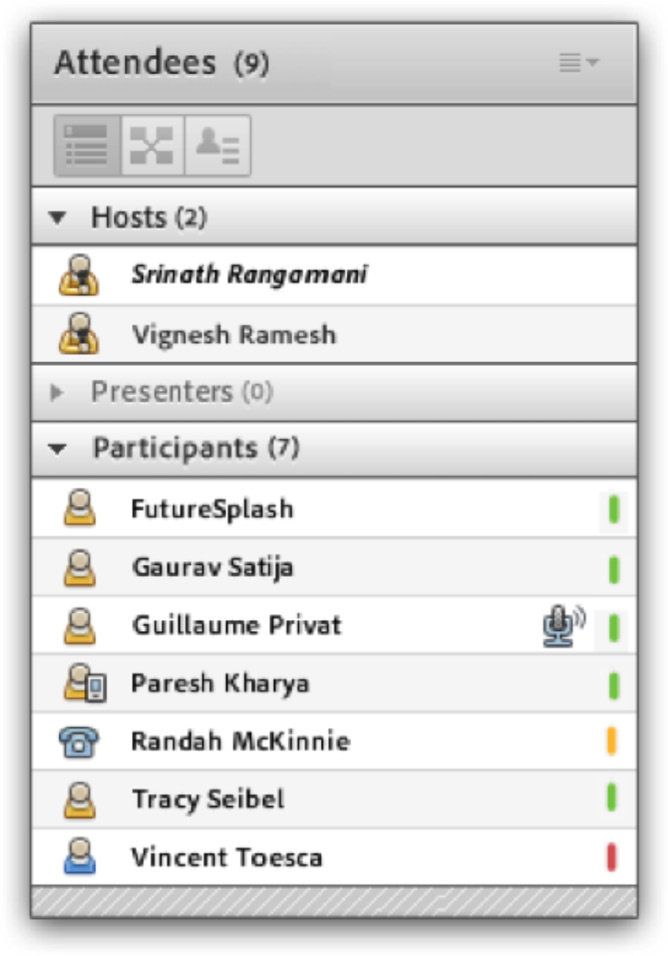
Monitoring individual engagement
The engagement score works best as an aggregate metric for medium to large meetings. However, there are scenarios like training sessions where the trainer may want to monitor the engagement of specific participants. Adobe Connect provides an option in the attendee pod called ?show individual engagement? that enables meeting hosts to see individual engagement. The individual engagement is shown as three different levels. Green: High engagement |
 |
Offering participants the option to opt-out
While engagement information is useful for meeting presenters, individual participants may not want to have their engagement tracked for privacy reasons.
Adobe Connect offers event administrators a choice in the Analytics Administration section of Event Management to enable an opt-out option for participants. Enabling opt-out lets participants choose not to be tracked for engagement information when they log in to the meeting. Event administrators can also display an additional opt-out notification at the start of the meeting.
Adobe Connect also provides a higher level of control to account administrators. With the compliance and control settings, they can disable the Engagement Dashboard for all meetings in their accounts.
Keeping participants engaged
Keeping participants engaged is a combination of the message as well as its delivery. Adobe Connect provides a number of tools to deliver engaging webinars easily and effectively. Here are some ideas that you can adapt for your situation.
- Judiciously use a lobby layout and the waiting time before the start of the meeting to gather feedback. Example: Poll the participants on their expectations for the webinar; ask them to share their location (there are Adobe Connect extensions available that show participant locations in a map), or ask participants to share their most pressing problems related to a topic in the chat pod.
- Have a panel of experts answering questions through the moderated Q&A. Introduce the panel and encourage participants to ask questions. The panel can answer the questions from the Presenter Only Area even while the presenter is presenting. Answering a few appropriate questions publically to all, rather than privately to the question asker, will encourage even more question asking and interaction.
- Use frequent polls to gather useful information and also plan to share that information with the other participants using the broadcast results option. Remember to give value to participants while you demand value. Do not limit polls to just multiple choice questions, but also ask open-ended questions as well using the short answer option. Broadcasting results of open-ended questions provides encouragement for more participation.
- Take live feedback in a manner similar to how you would do it in a physical meeting using the attendee status option of agree or disagree. You can then look at the aggregate responses in the ?attendee status view? of the attendee pod E.g.: You can ask ?Give me a virtual yea or nay for this quick poll, Is this meeting a good use of your time??notice the little button at the top of your meeting window with a raised hand image, that?s what you want to click and select either agree or disagree to share your response.
- Use weblinks and file share pods to share important information like whitepapers or product information brochures. Encourage participants to download files.
- Use an additional Chat pod for fun chat contributions at various times during your webinar. Example: Ask audience members to type their location while they are waiting for the webinar to begin. Or ask them if they can identify an actor or place referenced in a slide graphic.
- Initiating interactions in real time with a live audience is challenging. Minimize the switchover time by using carefully prepared layouts with pre-existing interactions and label the layouts appropriately. During the live meeting adding the interaction would then be just a single click to switch to an appropriate layout.
- Establish a designated hash tag for the webinar and encourage participants to use it. Share the results live using the twitter extension (TwitterConnect) in the webinar.
June 2013
<< Back to Tutorials main menu.
Member Comments
Share your thoughts. Tell us what you think about this tutorial.
Sign in to leave comments